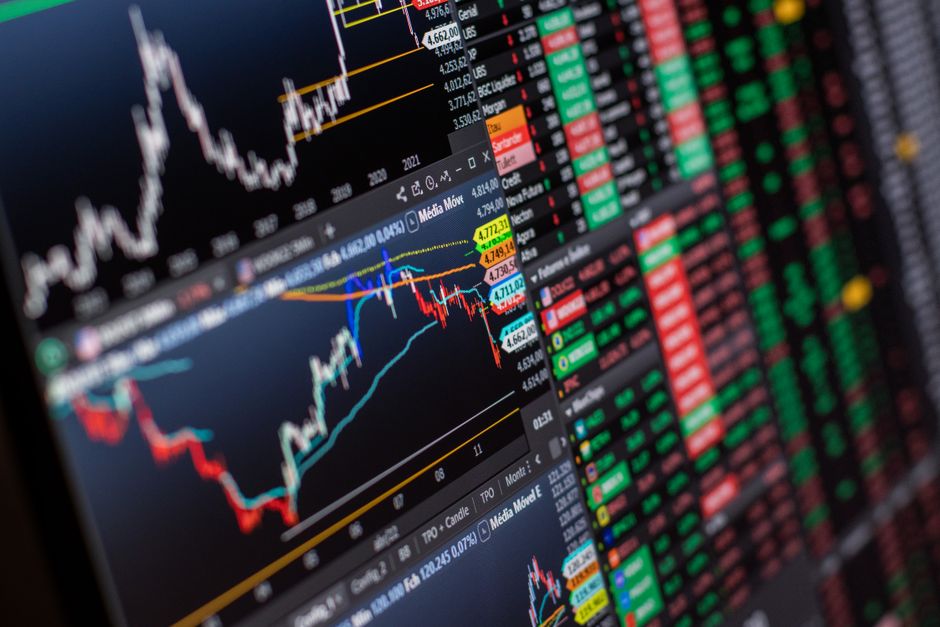
How to Backtest a Trading Bot Properly: A Practitioner’s No-BS Guide
Let’s be honest about something most trading tutorials won’t tell you: a great backtest is, paradoxically, a red flag.
If your strategy is returning 300% annually with a Sharpe ratio above 3.0 and a max drawdown of 4%, you haven’t found the Holy Grail — you’ve probably just overfit a curve to historical noise. The dirty secret of algorithmic trading is that almost anyone can build a strategy that looks incredible on paper. The skill — the actual hard part — is building one that you can trust when real money is on the line.
This guide is for people who want to do it right. Whether you’re building a crypto trading bot, an equity momentum strategy, or something AI-assisted, the principles here will help you separate signal from statistical fiction. We’ll cover the full pipeline: data sourcing, simulation architecture, the metrics that actually matter, and the systematic checks that keep you honest.
1. Background: What Backtesting Actually Is (and Isn’t)
Backtesting is the process of applying a trading strategy to historical market data to simulate how it would have performed. In theory, it’s a way to validate an idea before risking capital. In practice, it’s a minefield of cognitive biases, data artifacts, and technical errors that can make a losing strategy look like a winner.
The backtesting pipeline has three core components:
- Historical data: OHLCV (Open, High, Low, Close, Volume) data, order book snapshots, tick data, or alternative datasets
- Strategy logic: Entry/exit signals, position sizing, and risk rules encoded in software
- Simulation engine: The mechanism that replays market conditions and calculates P&L, accounting for transaction costs, slippage, and capital constraints
Modern tools — from Python libraries like backtrader and vectorbt to cloud platforms like QuantConnect and Freqtrade — have made it easier than ever to run a backtest in minutes. That accessibility is a double-edged sword. It’s lowered the barrier to entry, but it’s also made it trivially easy to fool yourself.
AI-assisted strategy development, using tools like Claude or GPT-4 to generate trading logic, adds another layer of complexity. As highlighted in research on algorithmic trading with AI coding assistants, the speed at which you can generate and test ideas dramatically increases the risk of data snooping — where you unconsciously (or consciously) keep testing until something sticks.
The Core Problem: Why Most Backtests Lie
Here’s the uncomfortable truth: the same dataset cannot be used to both develop and validate a strategy. Every time you look at your equity curve and tweak a parameter, you’re fitting your model to that specific history. By the 10th iteration, you’re not testing a strategy — you’re reverse-engineering the past.
This is why professional quant shops use rigorous out-of-sample testing, walk-forward analysis, and paper trading periods before deploying capital. Retail traders, lacking institutional discipline, routinely skip these steps and then wonder why their “proven” strategy falls apart in live markets.
2. Step 1 — Getting Your Data Right
Bad data produces bad backtests. It’s that simple. And yet data quality is the step most traders rush through.
Common Data Problems to Watch For
| Problem | What It Is | Impact on Results |
|---|---|---|
| Survivorship Bias | Only using data from assets that still exist today | Massively inflates returns; dead coins/stocks are excluded |
| Look-Ahead Bias | Accidentally using future data in signal calculation | Produces impossibly good results; strategy is fundamentally broken |
| Stale/Incorrect Data | Missing candles, incorrect timestamps, bad OHLCV values | Distorts performance metrics; can create phantom trades |
| Point-in-Time Issues | Fundamental data (earnings, etc.) that wasn’t available at the time | Strategy trades on information it couldn’t have had |
| Exchange-Specific Gaps | Crypto exchanges have downtime; data can have holes | Creates artificial signals at gap boundaries |
Where to Get Reliable Data
For crypto strategies, Binance’s historical data API, Kaiko, and CryptoCompare are commonly used sources. For equities, Polygon.io, Alpha Vantage, and QuantConnect’s built-in datasets are solid starting points. For serious work, pay for quality — free data sources are rife with errors.
Practical checklist for data validation:
- ✅ Verify candle counts match expected trading sessions
- ✅ Check for duplicate timestamps
- ✅ Confirm High >= Open/Close and Low <= Open/Close for every candle
- ✅ Identify and handle gaps (interpolation vs. skipping vs. flat-filling)
- ✅ Adjust for splits, dividends, and delistings (equities)
- ✅ For crypto: account for exchange-specific price differences (BTC price on Binance vs. Coinbase can diverge meaningfully during volatility)
One underappreciated tip: always backtest against multiple data sources for the same asset and compare results. If your strategy’s performance changes dramatically depending on which data provider you use, that’s a signal your edge is fragile and data-dependent.
3. Step 2 — Building a Realistic Simulation
This is where most self-built backtesting systems fall down. A realistic simulation isn’t just about replaying prices — it’s about modeling all the friction and constraints that exist in real markets.
Transaction Costs: The Silent Strategy Killer
Here’s a concrete example. Say your strategy generates 200 trades per month with an average gross return of 0.3% per trade. That sounds fine. But let’s run the math with realistic costs:
- Maker/taker fee on Binance: ~0.1% per side → 0.2% round-trip
- Estimated slippage on a $10,000 position in a mid-cap altcoin: ~0.1–0.3%
- Total cost per trade: 0.3–0.5%
At 0.3% gross return and 0.4% cost per trade, you’re losing money on every single trade. A backtest that ignores fees will show this strategy as profitable. A realistic one reveals it as a donation to the exchange.
Always model costs at the high end of what you’d realistically pay. If the strategy still looks good with aggressive cost assumptions, you have a more robust edge.
Slippage and Market Impact
Slippage — the difference between your expected fill price and the actual fill — is non-trivial, especially for larger positions or low-liquidity assets. A common modeling approach:
- Fixed slippage model: Apply a flat X basis points to every trade (simple but often too generous)
- Volume-weighted slippage: Scale slippage based on your order size relative to average daily volume
- Order book simulation: The most accurate method; requires tick-level data
For most retail-sized bots (positions under $50,000 in liquid markets), a conservative fixed slippage assumption of 5–15 basis points per trade is a reasonable starting point. For anything larger or in less liquid markets, model it explicitly.
Position Sizing and Risk Rules
Your simulation needs to mirror your intended live trading rules:
- Fixed fractional sizing (e.g., risk 1% of equity per trade)
- Kelly Criterion sizing (powerful but dangerous to apply naively)
- Maximum concurrent positions and correlation limits
- Maximum drawdown stops that halt trading
- Leverage constraints
A strategy that uses 100% of capital in a single position will have very different risk characteristics than one that distributes across 10 positions. Make sure your simulation reflects your actual intent.
The Bar Resolution Problem
If you’re using daily candles, your backtest assumes you can execute at the open of the next bar after a signal fires. In reality, you might miss that price by a meaningful margin, especially in crypto where moves happen fast. For higher-frequency strategies, use the resolution you actually trade on — 1-minute or 5-minute bars — and build in realistic execution delays of at least one full bar after signal generation.
4. Step 3 — Avoiding Overfitting (The Most Important Section)
Overfitting is the central problem in quantitative trading. It’s the reason why most strategies that look incredible in backtests fail in live markets. Understanding it deeply is what separates serious practitioners from hobbyists.
What Overfitting Looks Like in Practice
Imagine you’re testing an RSI-based strategy. You test RSI periods of 7, 9, 14, 21. You find that 9 gives the best results. You test overbought thresholds of 65, 70, 75, 80. You find 72 works best. You do the same for lookback periods, moving average crosses, and volume filters. After 50+ parameter combinations, you’ve found something that fits the historical data beautifully.
But here’s the problem: with enough free parameters, you can fit any dataset to any curve. You haven’t found a strategy — you’ve found the mathematical description of past price action. When the market changes (and it always does), your over-specified strategy falls apart.
The Train/Validate/Test Split
Borrow from machine learning. Divide your data into three non-overlapping periods:
- Training set (in-sample): Where you develop and optimize the strategy (~60% of data)
- Validation set: Where you tune parameters and select the final version (~20%)
- Test set (out-of-sample): Touched only once, at the very end, to get an unbiased estimate of performance (~20%)
The test set result is your true expectation for live performance. If it diverges significantly from training results, you’ve overfit. The validation set result will usually be better than the test set (since you’ve used it in the selection process), which is normal — but both should be in the same ballpark as the training set.
Walk-Forward Analysis: The Gold Standard
Walk-forward analysis is more rigorous than a single train/test split. Here’s how it works:
- Optimize strategy parameters on period 1 (e.g., Jan 2020 – Dec 2021)
- Test those parameters on the next period out-of-sample (e.g., Jan 2022 – Jun 2022)
- Re-optimize on periods 1+2, test on period 3
- Repeat until you’ve covered the full dataset
- Chain the out-of-sample segments together into a continuous equity curve
This walk-forward equity curve is a far more realistic picture of how your strategy adapts (or fails to adapt) as market regimes change. A strategy that performs consistently across multiple walk-forward windows is genuinely robust; one that only works in one or two windows is a regime-specific artifact.
Statistical Significance and the Multiple Testing Problem
If you test 100 parameter combinations, you’d expect roughly 5 of them to appear statistically significant at the 95% confidence level purely by chance. This is the multiple comparisons problem, and it’s devastating in trading strategy research.
Corrections to apply:
- Bonferroni correction: Divide your significance threshold by the number of tests
- Minimum track record length: A strategy needs at least 45–60 trades to have statistical meaning; ideally 200+
- Combinatorial purged cross-validation (CPCV): Advanced technique from Marcos López de Prado’s work; highly recommended for serious practitioners
- Deflated Sharpe Ratio: Adjusts the Sharpe Ratio downward based on how many strategy variations you tried
5. Step 4 — The Metrics That Actually Matter
Raw return is a terrible way to evaluate a backtest. Here are the metrics that experienced practitioners actually care about:
| Metric | What It Measures | Good Threshold (general) |
|---|---|---|
| Sharpe Ratio | Return per unit of volatility (annualized) | > 1.0 acceptable, > 1.5 good, > 2.0 exceptional |
| Sortino Ratio | Like Sharpe, but only penalizes downside volatility | > 1.5 good for trending strategies |
| Max Drawdown | Largest peak-to-trough loss in equity | Should be psychologically survivable; < 20% for most retail traders |
| Calmar Ratio | Annualized return / Max drawdown | > 1.0 good; reflects return per unit of worst-case pain |
| Win Rate | % of trades that are profitable | Context-dependent; a 30% win rate can be excellent with good R:R |
| Profit Factor | Gross profit / Gross loss | > 1.5 solid; > 2.0 strong |
| Expectancy | Average $ return per trade | Must be positive; ideally > 2x transaction costs |
| Recovery Factor | Net profit / Max drawdown | > 3.0 good |
One metric that doesn’t get enough attention: drawdown duration. A strategy with a 15% max drawdown that recovers in 2 weeks is very different from one with a 15% drawdown that takes 8 months to recover. Long recovery periods test psychological endurance and often cause traders to abandon a strategy right before it recovers — locking in real losses.
The Regime Analysis Check
Break your backtest into different market regimes and analyze performance separately:
- Bull markets vs. bear markets vs. sideways chop
- High volatility periods (VIX > 25 for equities) vs. low volatility
- Pre- and post-major macro events (COVID crash, rate hike cycles, etc.)
A robust strategy should have a plausible explanation for why it works in each regime — or it should clearly be a regime-specific strategy with appropriate restrictions on when it’s deployed.
6. Multiple Perspectives: Who Backtests and How They Differ
The Retail Trader
Most retail traders using tools like Freqtrade, 3Commas, or custom Python bots are working with limited data, limited compute, and no institutional infrastructure. The main risks: survivorship bias in asset selection, inadequate cost modeling, and heavy overfitting from manual parameter tweaking. The practical advice here is to keep strategies simple (fewer parameters = less overfitting risk), and to be brutally skeptical of any result that seems too good.
The Institutional Quant
Professional quant funds (think Two Sigma, Renaissance, or AQR) have access to proprietary data, sophisticated execution infrastructure, and teams of statisticians whose entire job is to prevent overfitting. They typically run strategies across hundreds of instruments simultaneously, use ensemble approaches, and have strict risk management overlays. The bar for “good enough to trade” is far higher than most retail traders realize.
The AI-Augmented Developer
An emerging category: traders who use AI coding assistants (Claude, GPT-4, Gemini) to rapidly generate and test strategy variations. This approach, discussed in the context of algorithmic trading with tools like Claude Code, dramatically accelerates the ideation phase. The risk is dramatically accelerated overfitting — the same capability that lets you test 500 strategy variants in a weekend is the capability that will produce a statistically meaningless result if you’re not rigorous about out-of-sample testing and multiple-testing corrections. Speed is not a substitute for discipline.
7. Impact and Outlook: Where Backtesting Is Heading
The backtesting landscape is evolving quickly, and several trends are worth tracking:
Agent-Based Simulation
Rather than replaying static historical data, agent-based models simulate markets as emergent systems with multiple interacting participants. This can help test how a strategy performs when market microstructure responds to its own trading — particularly relevant for larger positions that might move markets.
Synthetic Data Generation
Using GANs (Generative Adversarial Networks) or other generative models to create synthetic price series that match the statistical properties of real markets allows for stress-testing across scenarios that haven’t occurred historically. This is already being explored by academic researchers and sophisticated funds.
AI Strategy Generation and the Overfitting Arms Race
As AI tools make it easier to generate and test strategies, the industry is developing more sophisticated defenses against overfitting. Techniques like the Deflated Sharpe Ratio, combinatorial cross-validation, and ensemble approach validation are moving from academic papers into practitioner toolkits. Traders who don’t understand these methods will increasingly be at a disadvantage.
Real-Time Backtesting and Paper Trading Integration
Modern platforms are blurring the line between backtesting and paper trading, allowing strategies to be validated in real-time market conditions without capital risk. This kind of “forward testing” before live deployment is becoming standard practice and should be considered a mandatory step in any serious deployment pipeline.
8. The Complete Backtesting Checklist
Here’s the actionable summary — treat this as your pre-deployment checklist:
📊 Data Quality
- ☐ Source data from a reliable, paid provider where possible
- ☐ Validate OHLCV integrity (High >= max(Open, Close), Low <= min(Open, Close))
- ☐ Identify and document all data gaps; apply consistent gap-handling policy
- ☐ Confirm no survivorship bias in asset universe
- ☐ Verify all signals use only point-in-time available data
⚙️ Simulation Realism
- ☐ Model commissions at realistic or pessimistic rates
- ☐ Include slippage estimates appropriate for position size and liquidity
- ☐ Enforce at least a 1-bar execution delay after signal
- ☐ Apply position sizing rules consistently
- ☐ Model concurrent position limits and capital allocation
🔬 Overfitting Prevention
- ☐ Split data into train / validation / test; touch test set only once
- ☐ Run walk-forward analysis with at least 5 windows
- ☐ Limit free parameters to the minimum necessary
- ☐ Apply Deflated Sharpe Ratio adjustment for number of strategy variants tested
- ☐ Require minimum 100+ trades for statistical relevance (200+ preferred)
📈 Performance Evaluation
- ☐ Report Sharpe Ratio, Sortino Ratio, Max Drawdown, and Calmar Ratio
- ☐ Analyze performance across different market regimes
- ☐ Assess drawdown duration, not just depth
- ☐ Confirm positive expectancy net of all costs
- ☐ Compare out-of-sample vs. in-sample performance (ratio should be > 0.5)
🚀 Pre-Deployment
- ☐ Paper trade for minimum 30 days (ideally 60–90 days)
- ☐ Verify live signals match backtest signals on the same data
- ☐ Start with minimum viable position size in live trading
- ☐ Define in advance the conditions under which you will halt the strategy
Conclusion: The Mindset Shift That Changes Everything
Here’s the original insight I want to leave you with: the goal of backtesting is not to find a strategy that works in backtesting. The goal is to ruthlessly eliminate strategies that don’t deserve to be traded live.
That’s a subtle but crucial reframe. When you approach backtesting as a validation tool rather than a performance-optimization tool, you naturally become more conservative, more rigorous, and more skeptical of your own results. You start asking “why should I trust this?” instead of “how do I make this look better?”
The strategies that survive that kind of brutal skepticism — the ones that hold up across multiple data sources, multiple walk-forward windows, multiple market regimes, and realistic cost assumptions — those are the ones worth trading. They might not have a 300% annualized return. They might look kind of boring. But boring and real beats exciting and fictional every single time when actual money is involved.
Take the time to do this right. Your future self — the one sitting in front of a live P&L screen — will thank you.
This article is for information only and is not financial advice.